How to integrate ReactGrid with Chart.js?

ReactGrid is a React.js component for displaying and editing data in a spreadsheet-like way. This guide shows you how to integrate it with the well-known pure Javascript library - Chart.js.
Why ReactGrid?
There are plenty of different data tables available on the Internet, which perform great if you want to display one object per row. Each of these objects has to have exactly the same static properties, which are mapped to columns in the table.
ReactGrid was designed to be independent of your data model. It doesn't care about your schema. You can render anything in any cell and thus you are able to display things the way you like it.
Unlike other grid components, ReactGrid also performs great on mobile devices or those with a touch capability and provides the same experience as on a desktop.
Before we get started let's list three main tasks:
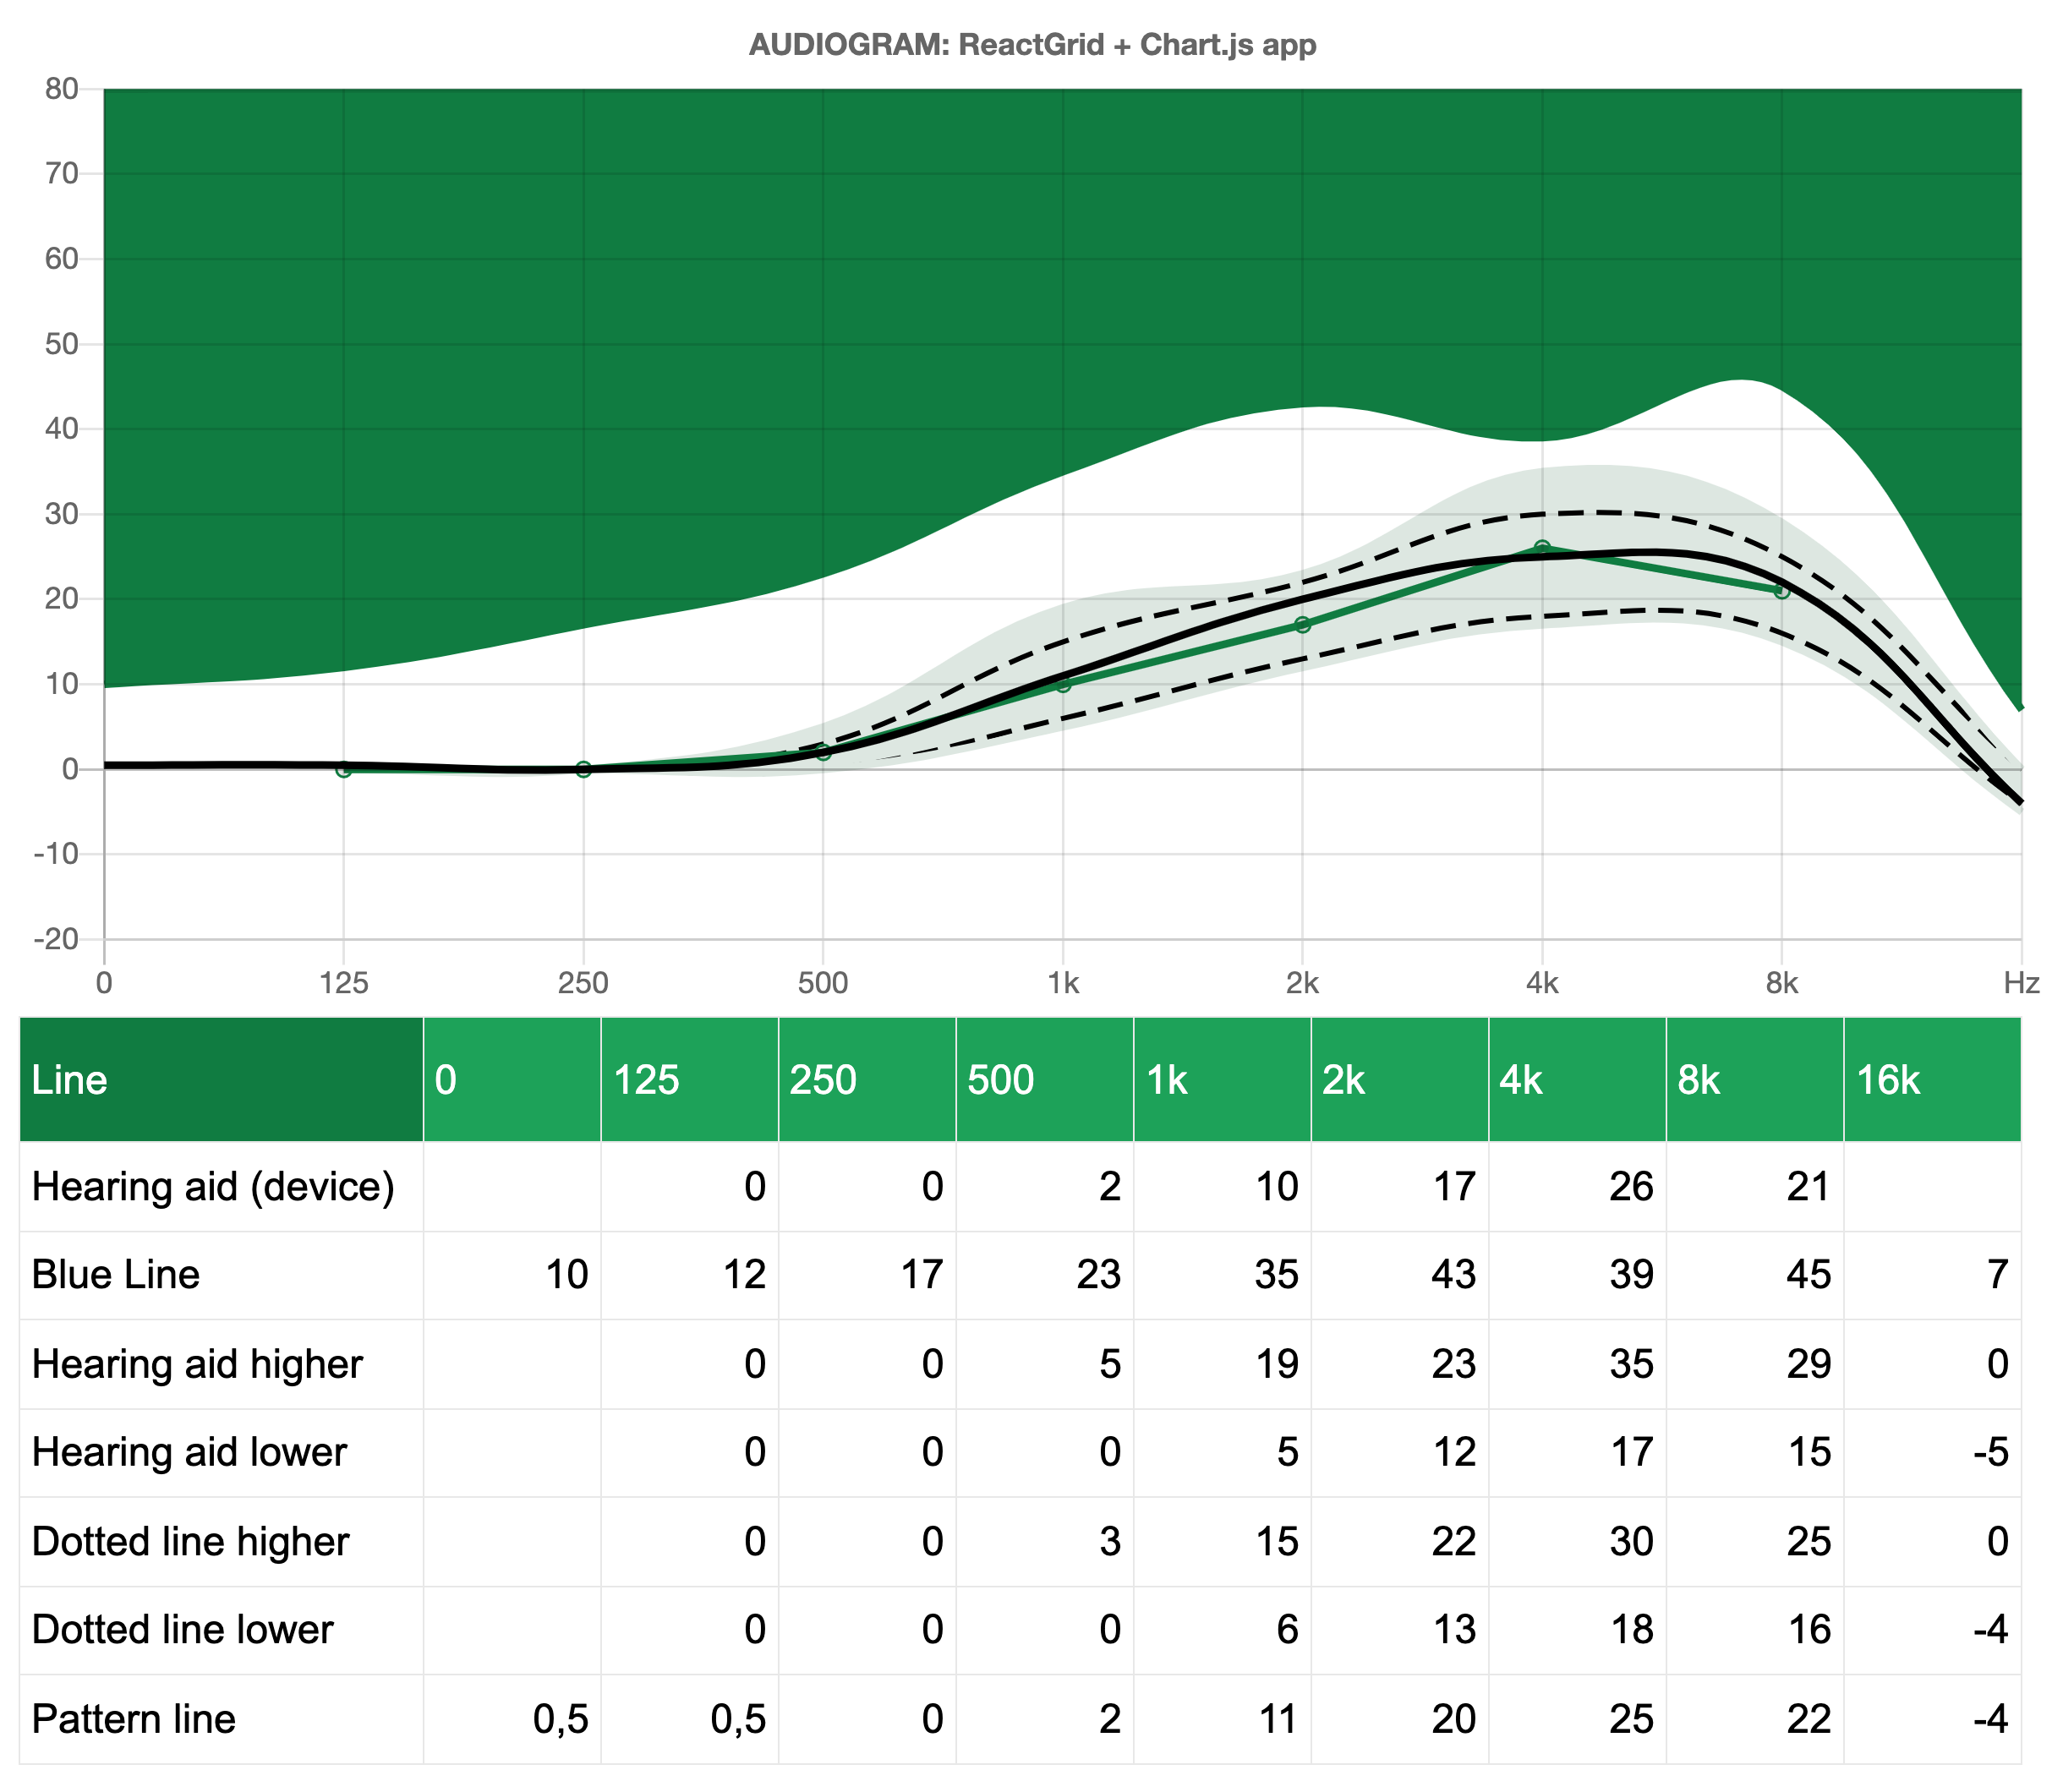
- displaying the collected data will be achieved with ReactGrid. To be reactive we will re-render the view only when the source data has changed. In this example, raw data comes from an audiometer - a device that is used for making hearing tests. In a nutshell, audiometer measures multiple hearing difficulties at many frequencies, and the audiogram is a way of visualizing such disorders.
- visualize the collected data on the line chart using Chart.jsand its React wrapper,
- add a possibility to enter a new value and rerender the whole view with an updated state.
Let's code!
Initialize the project
Nothing simpler - just type one of the commands below into your terminal to initiate a React app with Typescript support. 'Create React App' will take care of all the necessary stuff.
$ npx create-react-app reactgrid-chartjs-audiogram --template typescript
# or
$ yarn create react-app reactgrid-chartjs-audiogram --template typescript
Define useful interfaces and types
First, we need to declare a few interfaces and types that help us to keep everything in the right place and order. In this particular example, we know all about the data that we want to process. A good idea is to 'be as narrow' as possible.
/**
 * ReactGrid related interfaces - columns mapping
 */
export interface ColumnMap {
  line: "Line";
  "0": "0";
  "125": "125";
  "250": "250";
  "500": "500";
  "1000": "1k";
  "2000": "2k";
  "4000": "4k";
  "8000": "8k";
  "16000": "16k";
}

/**
 * Getting all object keys of ColumnMap interface,
 * e.g. "line" | "0" | "125" | "250" | ...
 */
export type ColumnKey = keyof ColumnMap;

/**
 * An union of all possible columns values,
 * e.g. "0" | "125" | ... | "8k" | "16k"
 */
export type Freq = ColumnMap[ColumnKey];

/**
 * Interface defines all of the rows that contais array of samples
 * with coresponding title
 */
export interface RowsMap {
  hearing_aid: "Hearing aid (device)";
  blue: "Blue Line";
  aid_higher: "Hearing aid higher";
  aid_lower: "Hearing aid lower";
  dotted_line_higher: "Dotted line higher";
  dotted_line_lower: "Dotted line lower";
  pattern_line: "Pattern line";
}

/**
 * An union of RowsMap kinterface keys,
 * e.g. "hearing_aid" | "blue" | "aid_higher"
 */
export type RowKey = keyof RowsMap;

/**
 * Main component props
 */
export interface AudiogramProps {
  color?: string;
  title?: string;
}

/**
 * Single frequency sample
 *
 * @example
 * const sample = { freq: '4k', value: 14 };
 */
export type FreqSample = {
  freq: Freq;
  value: number;
};

/**
 * Object that defines all the data collecte during
 * the course of the test
 */
export type Data = {
  [P in keyof RowsMap]: FreqSample[];
};
Mark the columns and rows
Relying on those interfaces now we can introduce getColumns function.
In our app, we got a Line column, and after that, we got columns which are related to a particular frequency from 0Hz to 16000Hz.
/**
 * Object that contains all possible columns including
 * the `line` (header of e.g. "Blue Line") and
 * all possible frequencies as object keys and their labels
 */
export const columnMap: ColumnMap = {
  line: "Line",
  0: "0",
  125: "125",
  250: "250",
  500: "500",
  1000: "1k",
  2000: "2k",
  4000: "4k",
  8000: "8k",
  16000: "16k"
};

/**
 * Function returns an array of ReactGrid compatible columns,
 * `columnId` coresponds to keyd of an object defined above
 */
export const getColumns = (): Column[] => [
  { columnId: "Line", width: 160 },
  { columnId: 0, width: 70 },
  { columnId: 125, width: 70 },
  { columnId: 250, width: 70 },
  { columnId: 500, width: 70 },
  { columnId: 1000, width: 70 },
  { columnId: 2000, width: 70 },
  { columnId: 4000, width: 70 },
  { columnId: 8000, width: 70 },
  { columnId: 16000, width: 70 }
];
The next stage is mapping all the rows. We make it in a similar way to previous examples.
/**
 * Object that contain all possible test results during
 * the course of the test
 */
export const rowsMap: RowsMap = {
  hearing_aid: "Hearing aid (device)",
  blue: "Blue Line",
  aid_higher: "Hearing aid higher",
  aid_lower: "Hearing aid lower",
  dotted_line_higher: "Dotted line higher",
  dotted_line_lower: "Dotted line lower",
  pattern_line: "Pattern line"
};
Define the data
As we defined our data, it's time to define our data that we are working on. getData function returns an object whose each key must exist within the RowsMap interface. Each key of this object contains an array of Freq objects.
export const getData = (): Data => {
  return {
    hearing_aid: [
      { freq: columnMap["0"], value: NaN },
      { freq: columnMap["125"], value: 0 },
      { freq: columnMap["250"], value: 0 },
      { freq: columnMap["500"], value: 2 },
      { freq: columnMap["1000"], value: 10 },
      { freq: columnMap["2000"], value: 17 },
      { freq: columnMap["4000"], value: 26 },
      { freq: columnMap["8000"], value: 21 },
      { freq: columnMap["16000"], value: NaN }
    ],
    blue: [
      { freq: columnMap["0"], value: 10 },
      { freq: columnMap["125"], value: 12 },
      { freq: columnMap["250"], value: 17 },
      { freq: columnMap["500"], value: 23 },
      { freq: columnMap["1000"], value: 35 },
      { freq: columnMap["2000"], value: 43 },
      { freq: columnMap["4000"], value: 39 },
      { freq: columnMap["8000"], value: 45 },
      { freq: columnMap["16000"], value: 7 }
    ],
    // ...
  };
};
Map the data to ReactGrid
Now we are ready to generate rows that directly feed into ReactGrid. Each row contains the same amount of cells, but all of them can be arbitrarily placed in any order.
const compare = (freqSample: FreqSample, freqKey: ColumnKey) =>
  freqSample.freq === columnMap[freqKey];

export const getRows = (
  data: Data,
  columnsOrder: ColumnKey[] = [
    "line",
    "0",
    "125",
    "250",
    "500",
    "1000",
    "2000",
    "4000",
    "8000",
    "16000"
  ],
  rowsOrder: RowKey[] = [
    "hearing_aid",
    "blue",
    "aid_higher",
    "aid_lower",
    "dotted_line_higher",
    "dotted_line_lower",
    "pattern_line"
  ]
): Row<NumberCell | TextCell | HeaderCell>[] => [
  ...rowsOrder.map<Row<NumberCell | TextCell | HeaderCell>>((rowKey) => {
    const item = data[rowKey];
    return {
      rowId: rowKey,
      height: 35,
      cells: [
        { type: "text", text: rowsMap[rowKey], nonEditable: true },
        ...columnsOrder
          .filter((column) => column !== "line")
          .map<NumberCell>((column) => ({
            type: "number",
            value: item.find((freqSample) => compare(freqSample, column)).value
          }))
      ]
    };
  })
];
The main component - Audiogram
It is time to create the main component - Audiogram and wrap up already written code.
As you can see we stored our data inside React useState hook.
ReactGrid always expects two props - columns (they are constant and don’t change over time) and rows (they are calculated every time the Audiogram component is rerendered).
const Audiogram: React.FC<AudiogramProps> = ({
  title = "AUDIOGRAM: ReactGrid + Chart.js app"
}) => {
  const [rawData, setRawData] = React.useState(getData());
  const columns = getColumns();
  const rows = getRows(rawData);

  return (
    <div className="chart" style={{ width: 800 }}>
      <ReactGrid rows={rows} columns={columns} />
    </div>
  );
};

export default Audiogram;
All that's left is to render the component with:
import * as React from "react";
import { render } from "react-dom";
import Audiogram from "./Audiogram";
import "./styles.css";

render(<Audiogram color="#107C41" />, document.getElementById("root"));

Apply changes with the cell editor
There are two things left to do:
- Add a header row to mark the data (devices and all the frequencies);
- Add possibility to edit data with ReactGrid's cell editor;
Adding the header row
To add it we have to create a short function called getHeaderRow. As an argument, it gets a column order (as keys of columns) and returns a row object that contains only a cell of the header type. We also added some green background to those cells.
export const getHeaderRow = (columnsOrder: ColumnKey[]): Row<HeaderCell> => ({
  rowId: "headerRow",
  height: 50,
  cells: columnsOrder.map<HeaderCell>(columnKey => ({
    type: "header",
    text: columnMap[columnKey],
    style: {
      background: columnKey !== "line" ? "#1DA259" : "#107C41",
      color: "white",
    },
  })),
})
Editing frequency values in cell editor
At this moment ReactGrid behaves as a read-only. To change that we updated the Audiogram component by adding our handler function called handleChanges. We expect that only NumberCell will be changed, therefore we marked the changes argument as CellChange<NumberCell>[]. Our task is to change data on the basis ReactGrid has been rendered.
Cell editor opens when it receives double-click action or the Enter key is pressed.
Then you can type a new value in and then commit the change. If we console.log(changes) we get an array of objects as shown below:
[
  {
    "type": "number",
    "columnId": "250",
    "rowId": "aid_lower",
    "previousCell": {
      "type": "number",
      "text": "0",
      "value": 0
    },
    "newCell": {
      "type": "number",
      "text":"45",
      "value": 45
    }
  }
]
To change our raw data we have to find rowId where the change takes place.
Then loop over all frequency samples and apply a new value (change.newCell.value) to an appropriate cell or just return without changes.
const Audiogram: React.FC<AudiogramProps> = ({
  title = "AUDIOGRAM: ReactGrid + Chart.js app"
}) => {
  const [rawData, setRawData] = React.useState(getData());
  const columns = getColumns();
  const rows = getRows(rawData);

  const handleChanges = (changes: CellChange<NumberCell>[]) =>
    setRawData((prevRawData) => {
      changes.forEach((change) => {
        prevRawData[change.rowId] = prevRawData[
          change.rowId
        ].map((freqSample) =>
          freqSample.freq === columnMap[change.columnId]
            ? { ...freqSample, value: change.newCell.value }
            : freqSample
        );
      });
      return { ...prevRawData };
    });

  return (
    <div className="chart" style={{ width: 800 }}>
      <Line data={getChartData(rawData)} options={getChartOptions(title)} />
      <ReactGrid rows={rows} columns={columns} onCellsChanged={handleChanges} />
    </div>
  );
};
Data visualization with Chart.js
Chart.js library delivers plenty of components to visualize data, but this time we focus on a single one - Line from react-chartjs-2 that we can use as a React component.
We have to create two functions:
getChartData- this function should return an object that contains two fields. Thelabels- which is an array of frequency title label and thendatasetsfield to provide thedatafield which contains an array of values for each frequency. You can also style your line by setting for example abackgroundColororpointRadiusfor a better experience.
export const getChartData = (rawData: Data, max: number = 80): ChartData => ({
  labels: ["0", "125", "250", "500", "1k", "2k", "4k", "8k", "Hz"],
  datasets: [
    {
      label: "Chart max",
      data: new Array(9).fill(max),
      pointRadius: 0,
      backgroundColor: "#107C41",
      fill: "+1"
    },
    {
      label: "",
      borderColor: "#107C41",
      fill: false,
      data: rawData.blue.map(({ value }) => value),
      pointRadius: 0
    },
    // ...
  ]
});
getChartOptions- here we return an object that is compatible withChartOptionsinterface. We want to disable legend, set the title, display, and adjust axes.
That's all! The job is done, now you can check the result below.

Summary
What you learned after completing this guide:
- what is ReactGrid and how to do a fully functional app;
- how you can use it in a reactive way;
- why Typescript is also helpful in a small-scale project to avoid the most common mistakes.
As you see integrating ReactGrid with other libraries like Chart.js is not so hard. Of course, you don't need to start a Typescript project and make all data mappings to compose a predictable solution.


